Measuring technology is a fundamental part of paper physics. Today’s sensor technology provides new and deep insights into the paper structure and production technology. Typical issues are the evaluation of pulps, papers and cardboards and their behavior in paper recycling. Typical applications are the evaluation of pulps, paper, and board as well as their products and their behavior in the paper recycling loops, for example, fiber analysis, paper testing, and recyclability investigations.

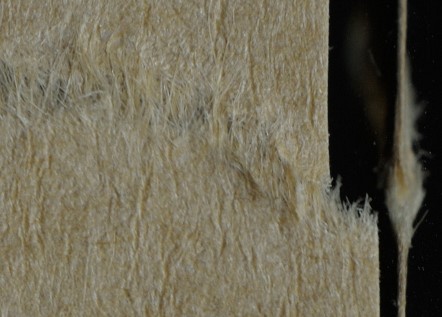
Paper physics and metrology

For the evaluation of processes in the stock preparation and paper production different measuring methods and adapted analytical techniques are needed. A wide range of different measurement and analysis methods are available at our department. Besides the application of well-established measurement methods, we are actively working on the development of new measurement and analysis methods. For most of these projects, image analysis plays an important role, because multiple techniques for the creation of pictures are available and powerful computers enable effective evaluation algorithms for these pictures.

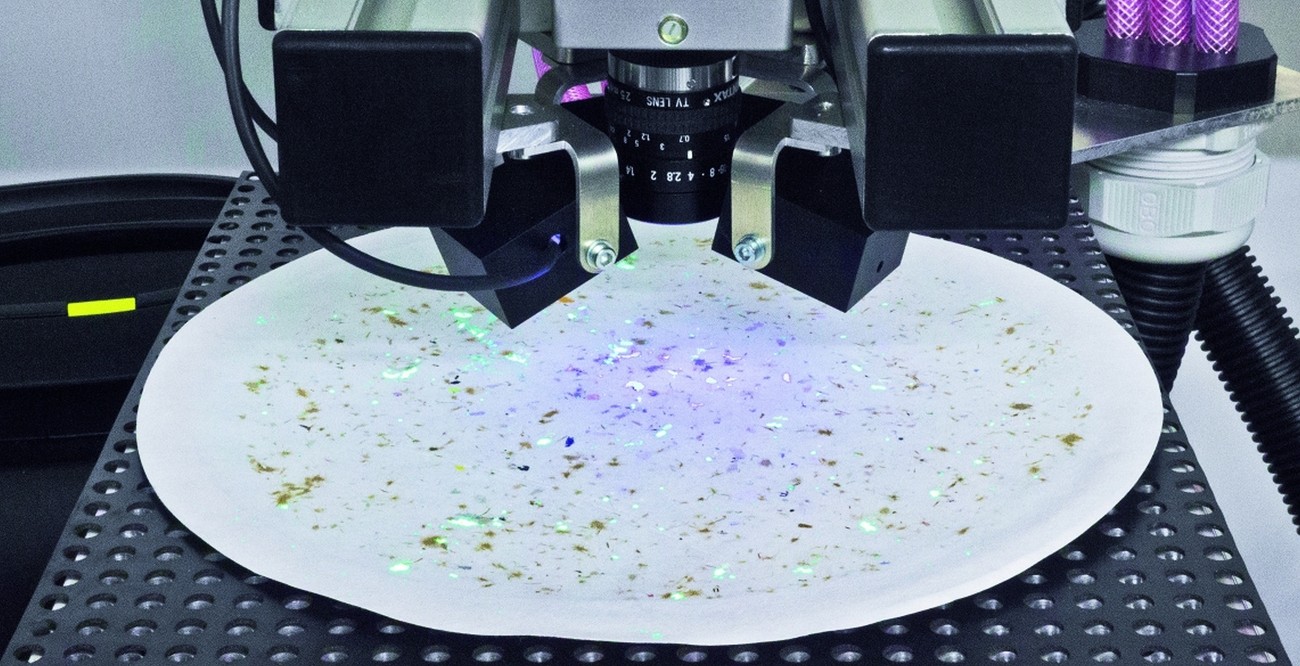
Selected Examples from our activities are the analysis of morphological fibre properties by fuzzy clustering algorithms, the highly precise wire mark analysis and determination of local deformation under tensile strain.

The Fibre-Class-Algorithm developed at PMV uses fuzzy clustering methods to condensate and interpret data from an image-based fiber analysis system. These data can be correlated with process parameters if needed. Camera-based fiber analysis systems provide many data. The software of commercial systems condensates these data so strongly to mean values, standard deviations, and similar sum parameters, that they cannot be correlated with variations in the process or the product. Our approach uses the original data to evaluate specific issues with intelligent algorithms. Once these algorithms are trained, such systems can be used to control the process or quality. Figure XX shows how such methods can be used in a pulp mill to predict the strength properties from morphological data from the pulp.

Another field where fuzzy clustering algorithms are used in image analysis is the wire mark analysis.

In the last years, the PMV succeeded to improve the algorithms so far, that the precision of the evaluation was raised significantly and the wire mark analysis can be used for automated process and quality control. For example with today’s algorithms, it is possible to gain information about the different layers of upper and lower wire of modern gap formers.

The deformation of paper under load is long been investigated. However, up to now, no method can measure the deformation of a sample in all three dimensions simultaneously with a high resolution. We use for this purpose a commercially available camera that is observing a sample clamped in a tensile testing machine. From the deformation of surface structures of the paper during the loading deformation values for the paper plane can be calculated. In the newest setup, a lateral view of the sample is displayed into the camera over a mirror.

With the corresponding lenses and suited algorithms for the evaluation, the change of the paper thickness can be determined with high local resolution parallel to the deformation of the paper in the paper plane. Besides the strains in all three dimensions, the transversal contraction can be determined. This evaluation method can be effectively combined with the ultrasonic based “Tensile Stiffness Orientation Tester”. Currently, a semi-automatic setup in a test lane is tested.

The measurement of dirt specs is also long in use and widely established. Camera-based measurements like the Equivalent Black Area (EBA) according to Tappi T563 have the disadvantage that only a relatively small area is captured and evaluated. Therefore mostly scanners are used to measure larger areas like lab sheet. Normally a defined and homogeneous illumination is not granted when scanners are used. That is why we designed a setup as shown in fig. xx that can measure a very large area of 450 cm², which is illuminated homogeneously circumferential from all sides in an angle of 45° ± 5°, accordingly to the corresponding standard. Because of the circumferential illumination, the machine direction of the sample during the testing does not matter. A commercially available high-resolution camera is used. When one-sided illumination is used the structure of the sample surface as well as light trapping and shadowing effects at dirt specs are influencing the results. These effects are also important for the evaluation of the printability. All in all this camera-based test design creates significantly more accurate data because the local optical properties are captured correctly and accordingly to the standard in contrast to scanner based test design.